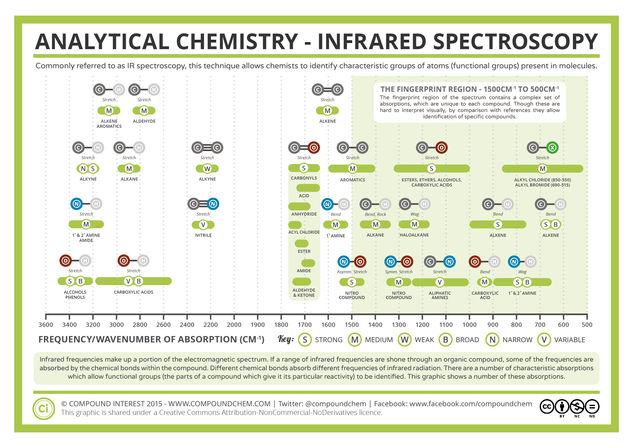
© Compound InterestInfrared (IR) Spectroscopy - Analytical Chemistry
I’ve been covering infrared spectroscopy recently with one of my A level classes, and realised that I haven’t really come across an aesthetically appealing reference chart for the frequencies of absorption – which seemed like as good an excuse as any to make one myself. So, here it is! Now, if you’re not a chemist, you may well be wondering what on earth IR spectroscopy is, so I’ve put together a brief explanation below.
In general, spectroscopy is the study of the interaction between light and matter. Infrared spectroscopy is a particular technique that can be used to help identify organic (carbon-based) compounds. Visible light is just a portion of the electromagnetic spectrum, and it’s the infrared section of the spectrum that’s utilised in this technique. It works by shining infrared light through the organic compound we want to identify; some of the frequencies are absorbed by the compound, and if we monitor the light that makes it through, the exact frequencies of the absorptions can be used to identify specific groups of atoms within the molecules.


